GPU Profiler
Overview
GPU Profiler is mainly used to display the GPU time usage of the application, providing real-time frame-by-frame statistics for the main rendering categories.
Opening the GPU Profiler
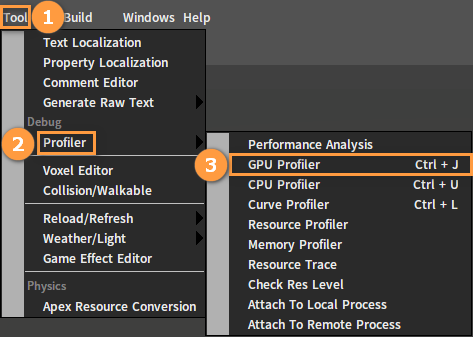
Click Tool -> Profiler -> GPU Profiler (Ctrl+J) to open the GPU Profiler.
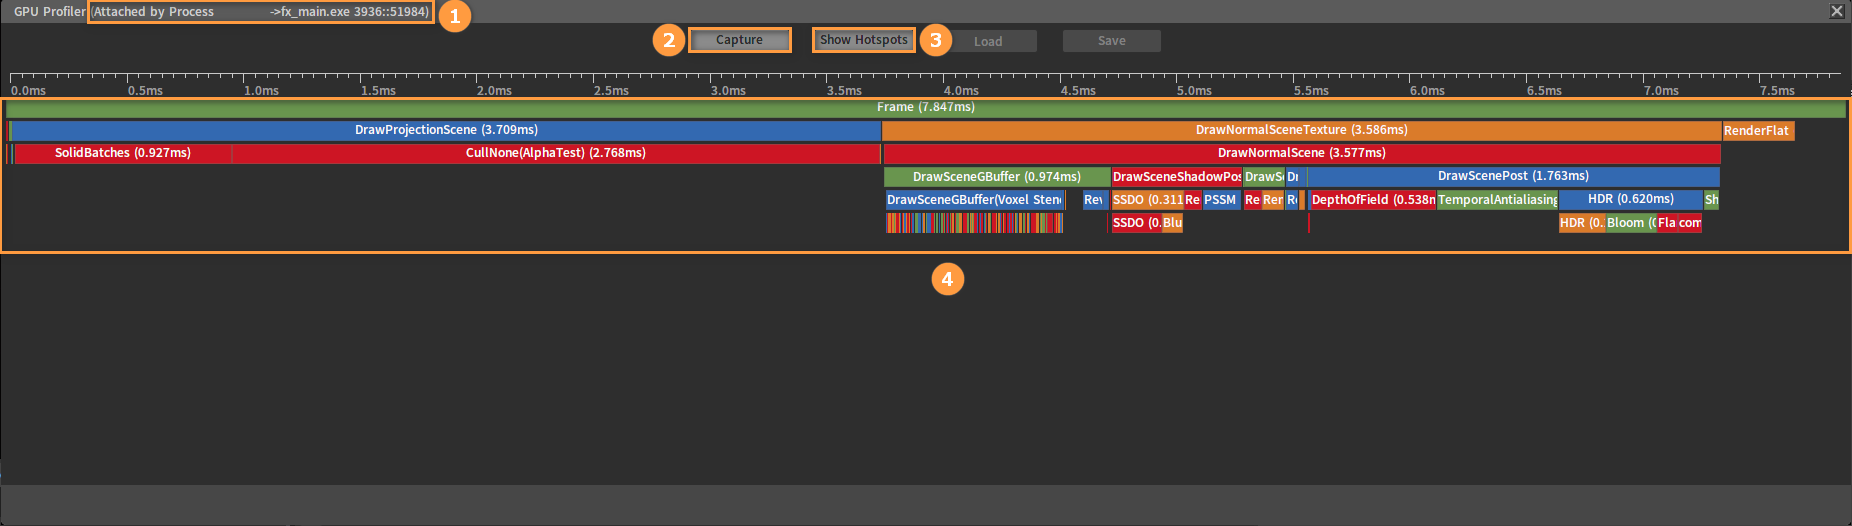
The GPU Profiler interface is shown below.
| No. | Name | Description |
|---|---|---|
| 1 | Title Bar | Show host name and corresponding process. |
| 2 | Capture | Recapture information about time consuming of GPU rendering in all aspects. |
| 3 | Show Hotspots | View detailed information about time consuming of GPU rendering in all aspects. |
| 4 | GPU Profiling Panel | Time consuming of GPU rendering in all aspects. |
GPU Profiling Panel
The GPU Profiling Panel outlines the breakdown of the time spent by the application within the captured frame in the form of timelines and graphics.
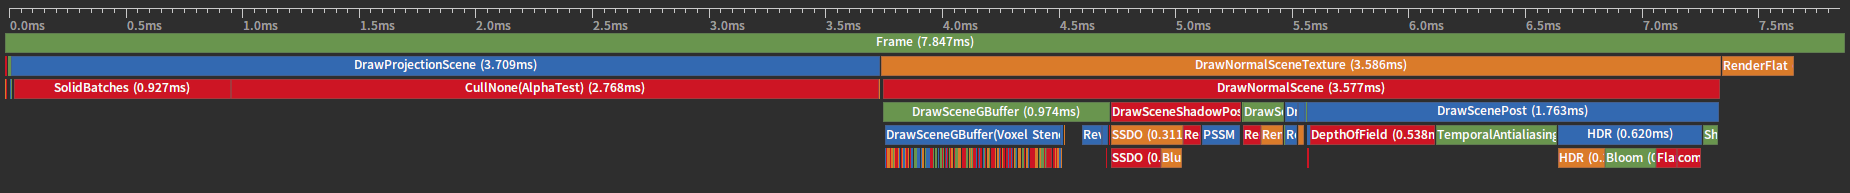
The GPU Profiling Panel displays timelines of the captured frame length and its hierarchical time data, where you can view the breakdown of contributions.
Frame in this panel refers to the rendering time of a frame cycle, where DrawProjectionScene and DrawNormalSceneTexture represent the rendering time of a scene, SolidBatches represents the time consuming of a certain section in the rendering process, and terminal leaf nodes such as RenderMaterialShadowMap, etc. represent the time consuming of a rendering feature.
Here are the details of the GPU Profiling Panel.
| Name | Description |
|---|---|
Frame | Total time consuming of the current frame |
DrawProjectionScene | Draw projection scenes |
DrawNormalSceneTexture | Render the deferred shaded scenes to maps |
DrawNormalScene | Draw normal scenes |
RenderFlat | Render flats |
TemporalAntialiasing | Anti-aliasing |
HDR | High dynamic range/HDR images |
Bloom | Bloom effects |
DepthOfField | Depth of field post-processing objects |
ColorTransformLUT | Transform color from Color LUT |
RenderMaterialSolid RenderMaterialSolidColorPickRenderMaterialGBuffer RenderMaterialGBufferFitLandRenderMaterialGBufferLPVRSM RenderMaterialGBufferVoxelRenderMaterialDepth RenderMaterialBlendRenderMaterialBlendColorPick RenderMaterialEyeRenderMaterialEyeOcclusion RenderMaterialGrassRenderMaterialWater RenderMaterialWaterColorPickRenderMaterialUnderWater RenderMaterialAppliqueRenderMaterialAppliqueColorPick RenderMaterialVolumeFogRenderMaterialVolumeFogColorPick RenderMaterialGlowRenderMaterialRefraction RenderMaterialRefractionColorPickRenderMaterialShadowMap RenderMaterialSpecialRenderMaterialHairSolid RenderMaterialHairBlendRenderMaterialStencil RenderMaterialFlatShadowRenderMaterialStencilShadow | Render functions |
DrawSceneGBuffer DrawSceneShadowPostDrawSceneLightPost DrawSceneDepthDrawSceneSolid DrawRoundSceneDrawSceneSpecialSolid DrawSceneCelestialBodyDrawSceneSky DrawSceneAtmosphereShadowDrawScenePreAtmosphere DrawSceneAtmosphereDrawUnderWaterBatchs DrawScenePreWaterDrawSceneMirror DrawSceneWaterReflectDrawSceneWaterOld DrawSceneWaterGbufferDrawScenePriorBlend DrawSceneBlendDownLevelDrawSceneBlend DrawSceneTopmostDrawSceneRefraction DrawSceneGlowDrawSceneCombinePost DrawSceneDiffusePostDrawSceneSpecularPost DrawSceneSkinPostDrawSceneWaterFogPost DrawUpScaleBatchDrawScenePrePost DrawSceneAfterPostDrawScenePost DrawSceneHelperDrawSceneHelperColorPick DrawScenePictureDrawSceneLPVLightPost DrawSceneGBufferLightPostDrawSceneVelocity DrawSceneSpecialLightPostDrawSceneColorPick DrawScenePrecompute | Draw scene batches |
GPU Rendering Details Panel
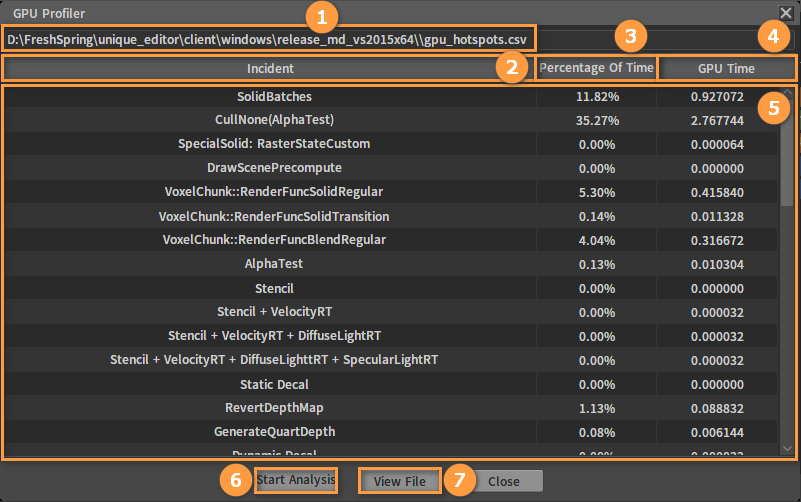
Click the Show Hotspots button to open the GPU Profiler window where all detailed information about GPU rendering can be viewed.
| No. | Name | Description |
|---|---|---|
| 1 | File Path | The file generated by GPU profiling, which records detailed information. |
| 2 | Incident | Incidents. |
| 3 | Percentage Of Time | Percentage of time. |
| 4 | GPU Time | Time consumed by GPU. |
| 5 | GPU Rendering Details Panel | Details of GPU profiling. |
| 6 | Start Analysis | Recapture and analyze details of GPU rendering. |
| 7 | View File | Open the file directory. |