CPU Profiler
Overview
CPU Profiler is mainly used to display the time spent by a program in the application.
Opening the CPU Profiler
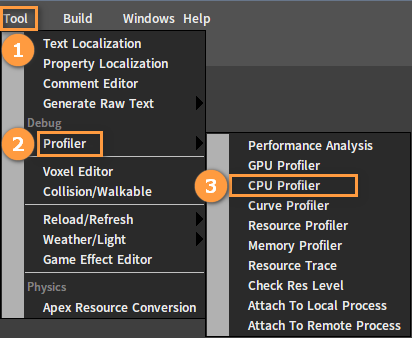
Click Tool -> Profiler -> CPU Profiler to open the CPU Profiler.
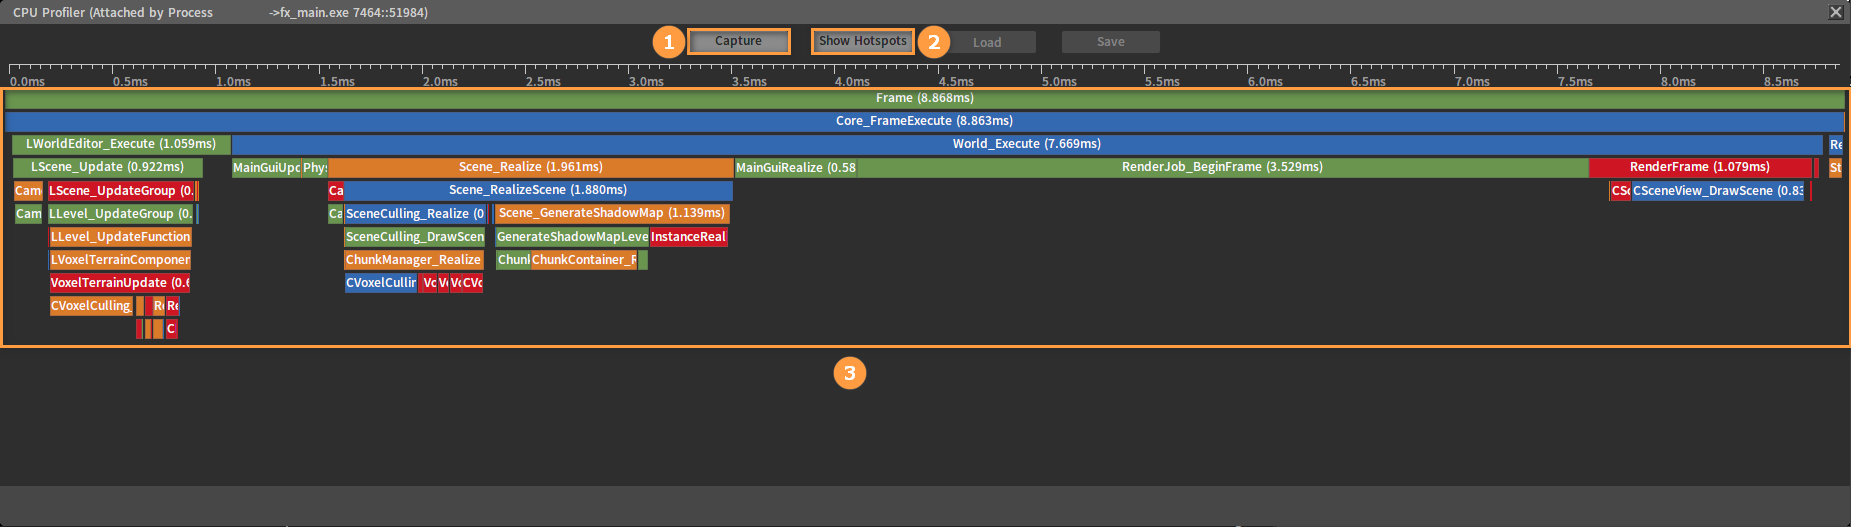
The CPU Profiler interface is shown below.
| No. | Name | Description |
|---|---|---|
| 1 | Capture | Get CPU debugging data once. |
| 2 | Show Hotspots | Display performance hotspots. |
| 3 | Details Panel | Mainly display the time range of the currently captured frames and the status of the time spent by each program in the application. |
Details Panel
The Details panel outlines the time spent by the program in the application and the relevance of that time in the form of timelines and graphics.
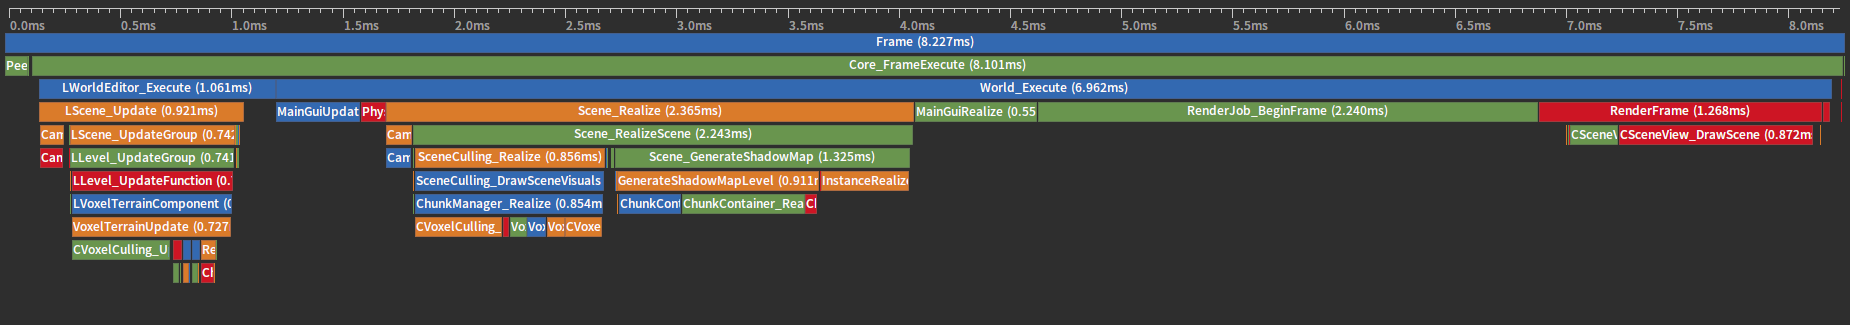
The Details Panel displays timelines of the captured frame length and its time breakdown information.
Four different colors are used to easily distinguish between function calls. Each square represents a program function with its length representing the execution time of the function. The longer the square, the more time the function is executed and the more energy is consumed. Each lower level represents other functions that the program function will call, and each higher level represents the function of a deeper level to be called. The bottommost squares represent the functions that are using the CPU when the frame is captured.
The Details Panel provides a clearer picture of the current project's work efficiency, different functions‘ call extent, association method and working states, whether they are in the waiting, idle or completed status.
Showing Performance Hotspots
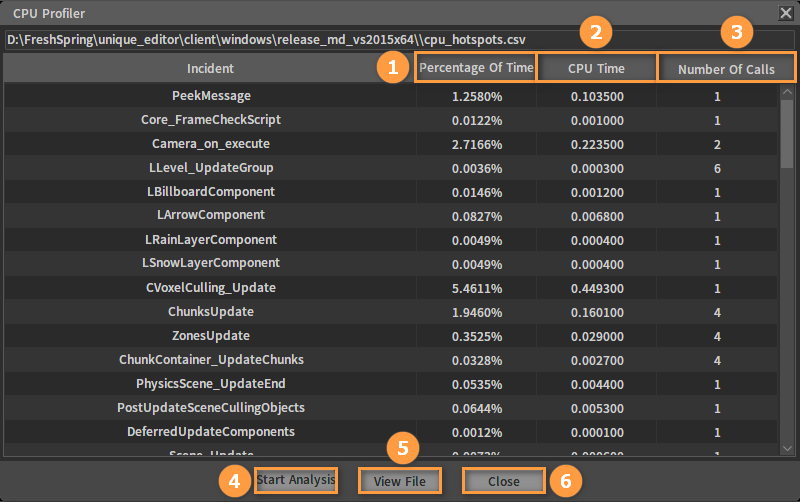
It is easier to find the code segment that takes the longest execution time in the program through the performance Hotspots display, so as to identify the cause of underperformance.
| No. | Name | Description |
|---|---|---|
| 1 | Percentage Of Time | Percentage of total time spent on this function. |
| 2 | CPU Time | Total time spent on this function (in milliseconds). |
| 3 | Number Of Calls | Number of times this function has been called in the current frame. |
| 4 | Start Analysis | Capture performance data once and generate detailed information. |
| 5 | View File | Automatically pop up the folder where the file is located. |
| 6 | Close | Close window. |